
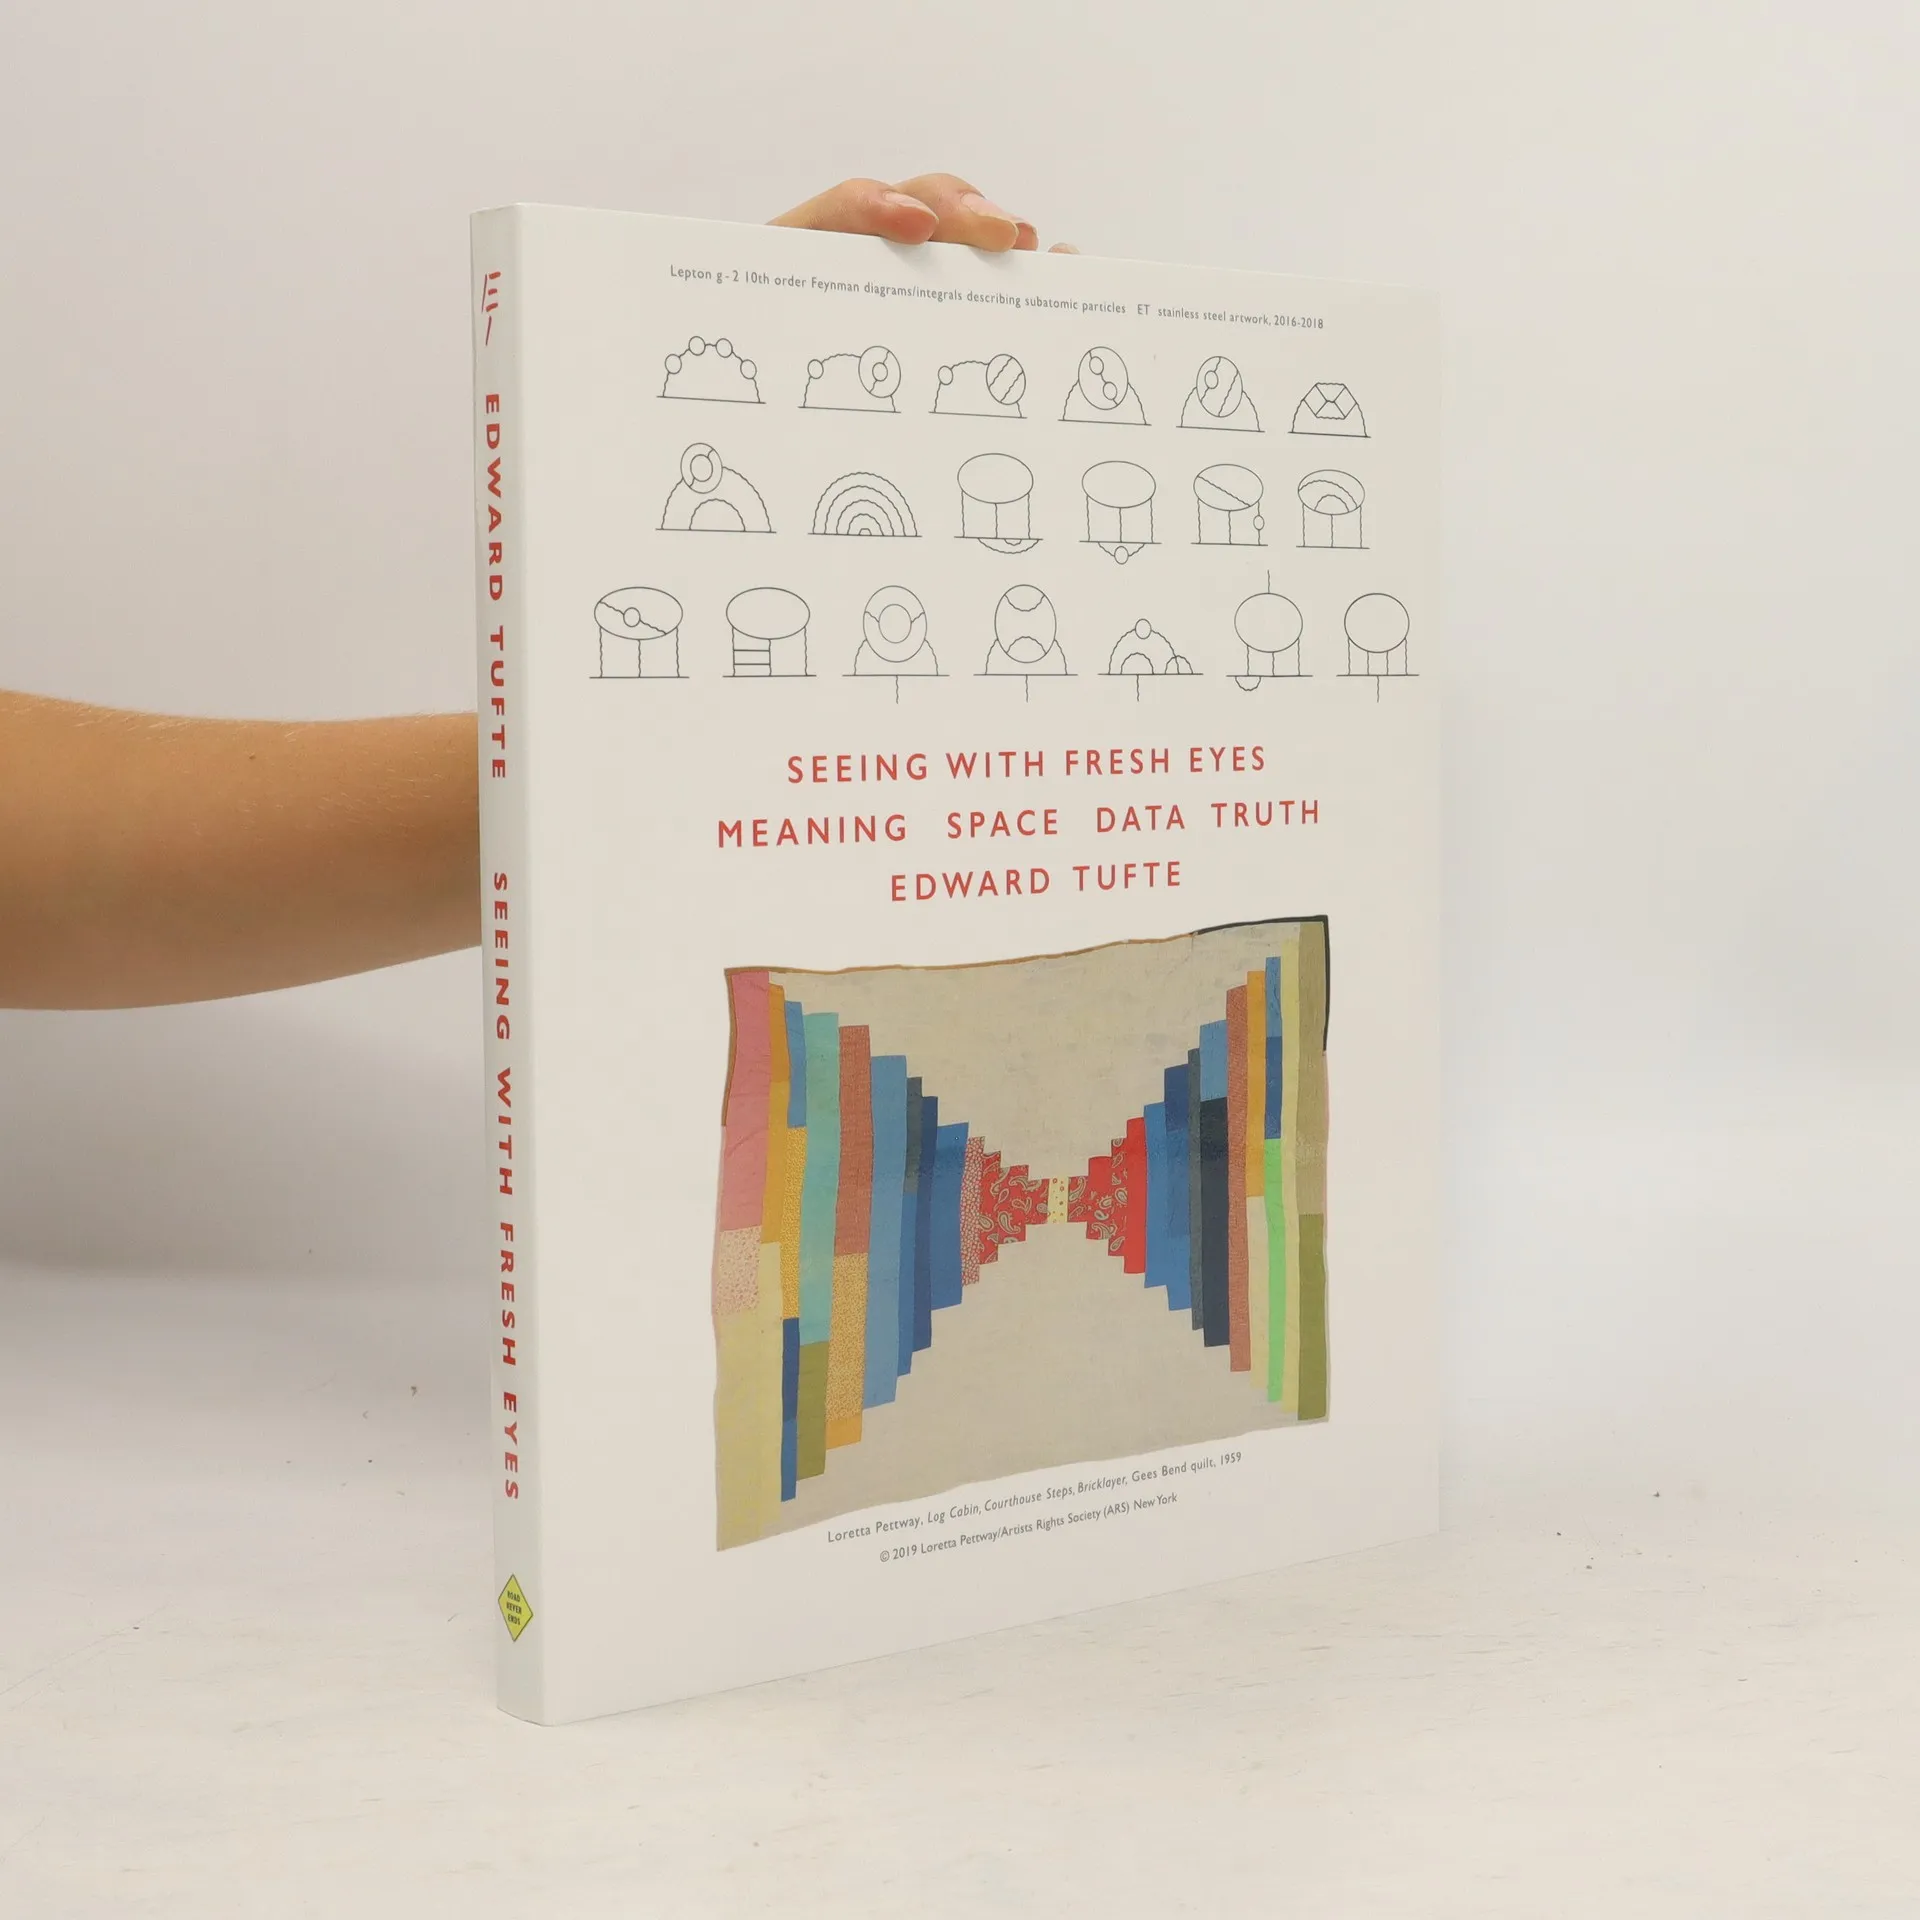


Seeing with Fresh Eyes
- 174 Seiten
- 7 Lesestunden
The Thinking Eye 4. 1 Meaning And See With Fresh Eyes, Question Everything, Remodel Conventional Models 6. 2 Content-Responsive Typography, Redesigning Sentences, Paragraphs, Labels 49. 3 Graphical Nouns And Verbs, Structure And Function 64. 4 Data Analysis When Truth On The Relationship Between Evidence And Conclusions. Remodeling Statistical Practice And Teaching 81. 5 Explanatory Words, Numbers, Graphics, Images, Organized By Content-Responsive Local Grids. Is Thinking Just Annotating The World? 121. 6 Instructions At Point Of Need 131. 7 Theory And Practice 141. 8 Smarter And Shorter Remodeling Nonfiction Presentations 150. 9 A Visual Index, A Quilt Of Sources And Remodeling The Back-Matter In Books 162.